
Therapy-Science has the capability to present multiple iGraphs™ on a single view. These types of graphs are called multi-panel iGraphs™. Each multi-panel iGraph™ contains the same interactive features as a single panel iGraph™, although you can’t drag data paths between graphs. Multi-panel iGraphs™ can be used to display up to 6 graphs on the same page. This How-to article will show you how to create these multipanel iGraphs™, including more specialized multiple-baseline iGraphs™.
Creating a multi-panel iGraph™
In some cases it may be informative to show several data series representing different intervention targets, generalization probes and/or control measures for which you are currently collecting data. A basic multi-panel iGraph™ allows for variety of data to be shown, coordinate by time with different phases, phase labels and different units of measure (e.g., percent, 7-point scale).
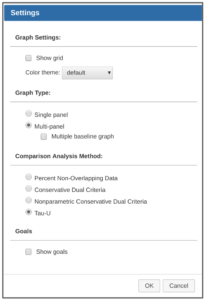
To create a multi-panel iGraph™, open the graph settings dialog (see figure on right) and select the Multi-panel option under the Graph Type heading and then select the “OK” button on the bottom of the dialog to save your changes.
If you also select the multiple baseline checkbox, the phase change lines will be connected between each iGraph™. Multiple baseline iGraphs™ will be discussed in more detail later in this How-To.
The Data Markup area below the multi-panel iGraph™ differs from a single-panel iGraph™, with a tab for each panel of the graph. To add a new graph panel, simply click the “+” tab on the far right. See the example below:
Customizing each panel of a multi-panel iGraph™
Each panel of a multi-panel iGraph™ can be customized to meet the needs of that particular data series. The y-Axis can have unique labels and ranges to help make that panel more effective at presenting the data. Changing the label and axis is accomplished by selecting either the label or axis to bring up a dialog that will allow for customization. Go ahead and click on the y-Axis label in the panels below to see how you can change them.
Creating a multiple-baseline iGraph™
A multiple baseline design is often used to assess the effect of a specific treatment across several behaviors, performance contexts and/or individuals. Interventions across these variables are often staggered and with the phase lines connected across iGraphs™, facilitating a visual analysis of whether an intervention effected only it’s target or generalized to other behaviors/contexts/individuals.
When choosing the multiple-baseline option in the iGraph™ settings panel (see above) The phase lines between iGraphs™ will be connected. In addition, only the phase labels associated with the first iGraph™ panel will be visible. See the example below:
You can set a multi-panel iGraph™ to be of the multiple baseline variety by selecting the Multiple baseline graph option in the graph settings dialog.
Comparing Data Series
One thing you’ll notice about multi-panel iGraphs™ is that you cannot drag data paths from one panel to another to compare data series across panels.
The nature of the multi-panel iGraph™ is to provide for a visual comparison of one (or more) data series in one panel as it is presented above (or below) another concurrent data series. If you are interested in a direct analytical comparison across data series, then those series should appear in the same panel.
See the second panel in the iGraph™ example below to see a graph that allows for a comparison of the data paths across two different data series in a single iGraph™. These can be compared analytically using the standard method of dragging and dropping a data path from one phase to any data path in another phase.